
Supra-Threshold Testing: Is It Time to Rethink Perimetry?
An interview with Prof. David B. Henson
Henson perimetry offers a fresh take on a crucial examination technique that offers to reduce testing time, improve accuracy, and result in greater data yield.
Visual field (VF) testing with standard automated perimetry (SAP) is plagued by three fundamental problems: High variability at moderate to severely damaged test locations (<20 dB),1,2 poor sensitivity to small central defects when testing with the 24-2 test pattern,3 and long test times. Solving these inherent limitations will require a rethink of the way we undertake VF testing.
A testing algorithm known as Smart Supra, available on the Henson 9000 perimeter (Topcon Healthcare), uses a uniquely designed, stepwise protocol that begins as a 26-point rapid screening test that is conducted in less than a minute. It can be performed using a single stimulus mode, in which a patient presses a button when they see a stimulus, or a multiple stimulus version, where the patient verbally reports the number of stimuli seen. In either case, the location of the stimuli is based on data from nearly 5,000 eyes with early VF loss, and the test has been validated to have over 90% sensitivity for detecting early loss.4
If any stimulus is missed by the patient, the test is extended to include a complete 24-2 assessment (with 54 points of measurement) or a combined 24-2 plus 10-2 visual field assessment (with 86 points). Because extra testing is added on an as-needed basis, building upon the initial screening phase without repeating any previously presented stimuli, the 86-point 24-2 plus 10-2 can be completed in around 3.5 minutes.
Shorter test times can improve the validity of the results, according to David B. Henson, PhD, Emeritus Professor of Ophthalmology & Vision Science at Manchester University in the United Kingdom and inventor of Smart Supra test. There is growing evidence that 24-2 perimetry testing, the most commonly performed perimetry test in clinical practice, is inadequately sensitive to early glaucomatous loss in the central 10°, with studies suggesting it appears normal in about 16% of eyes with central loss.5 Intuitively, the easiest solution would be to add more locations in the crucial central 10°. But doing so would extend testing time and make it impractical for clinical use—Prof. Henson and his team have estimated that sequentially performing 10-2 and 24-2 testing might take as much as 35 minutes for both eyes. More concerning, though, is that longer tests also undermine the results. In a study performed in his institution looking at pupil size during VF testing, Prof. Henson found that attention fatigue begins to compromise patients’ ability to accurately identify stimuli at around 3 minutes (Figure 1).6CLICK TO VIEW LARGER
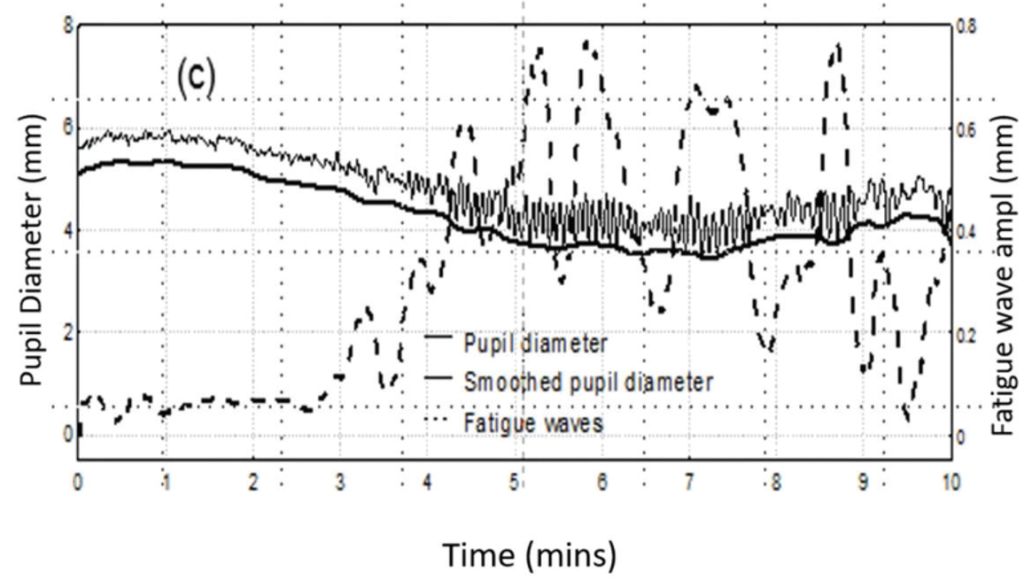
Figure 1. In a study, pupil size during VF testing (solid line) decreased over time as eye fatigue increased (see oscillations of pupil diameter). Superimposed over the two linear graphs is a mathematical model of the amplitude of fatigue waves over time (dashed line).
“The evidence here is that once you get beyond 3 to 4 minutes, the quality of the data reduces,” Prof. Henson said. “The patient is finding it difficult to maintain attention and becoming more variable in their responses.”
Improving perimetry testing accuracy
Integrating stimuli from the 24-2 and 10-2 test patterns into the Smart Supra test makes it more sensitive to central defects, those within 10°, than the standard 24-2 test. However, as a check against possible false positive results, the test automatically repeats any stimulus that the patient misses, whether it occurs during the rapid screen or during an extended test including 24-2 and/or 10-2. The stimulus is marked as missed only if it is missed twice during the same test. The Henson 9000 also allows the operator to manually retest at and around any missed stimulus point, again reducing the chances of false positives while also providing an opportunity to more accurately map any field loss occurring in areas in between the test pattern stimuli.
Another way the Henson 9000 improves the accuracy of perimetry testing is by using probability increments, meaning that the Smart Supra sets the threshold increment according to the normal variability found at each location, testing at levels which have a 95%, 98%, and 99% probability of being seen. These probability-based increments are determined using an age-adjusted reference database built into the Henson software.
“Probability increments mean that stimuli have an even probability of being seen across the visual field,” Prof. Henson said. “Near the fixation point, at the center of the field, the variability is much less than the variability toward the edge of the field. If you want to present something with a 95% limit, you need to know what the variability is at the center and choose your intensity there, and you need to know what the variability is at the edge and choose your intensity for that one. And so, the probability of it being seen anywhere in the field would be the same. If you use fixed increments, then you’re making the test less sensitive at the central part of the field or more sensitive at the edge of the field.”
As an additional consideration, supra-threshold testing also avoids unnecessary testing in areas of moderate to advanced loss (<20 dB). By comparison, SAP attempts to derive a threshold measure at these locations. Increasing evidence highlights that the large amount of variability at these locations makes trying to establish the threshold inefficient and unreliable.7 Thus, Smart Supra does not attempt to measure the thresholds at these highly damaged test locations. This makes it faster without sacrificing accuracy while also reducing patients’ anxiety by reducing the number of unseen presentations.
“Something we have learned over the years is that variability increases with the extent of loss. Once the threshold drops below 20 dB the test-retest variability is so large that almost any change in value on retesting becomes insignificant. This means that you really can’t derive an accurate threshold measurement at locations below 20 dB. It is better to focus resources on measuring more locations rather than trying to get accurate threshold estimates at these locations,” said Prof. Henson.
Additional benefits
Widescale implementation of a rapid screening protocol with a high degree of accuracy has immediate impact for providers and patients and might have significant public health implications, as well. One benefit of Smart Supra is that it can easily be performed by a technician each time a patient visits the optometrist. As a routine screen (as opposed to a targeted test), Smart Supra confers a greater theoretical chance of detecting early-stage disease in any given population, thereby offering a window of opportunity to initiate treatment when it is meaningful for preserving visual functioning. Indeed, evidence from the United Kingdom, where public health guidance suggests glaucoma screening for all individuals over the age of 40 years, and where Henson perimeters are widely used, back up that assumption.
“Over 90% of glaucoma [cases] in the United Kingdom come from optometrists who routinely screen. We have relatively few cases of advanced glaucoma because we capture them much earlier than many other countries,” said Prof. Henson.
Some additional features of the Henson 9000 speak to the platform’s ease of integration. For example, Topcon recently introduced a COVID-19 shield that converts the device from an open bowl perimeter to a closed bowl perimeter to make it easier to disinfect. As well, the Henson 9000 has built in networking and Wi-Fi, meaning a network of Hensons can wirelessly (or hard wire) link to a server where all the field data are stored for easy accessibility, recall, and linkage to all the other Hensons and workstations.
The Henson 9000 also offers users the option of using ZATA, a threshold algorithm with a full suite of progression analysis tools. ZATA uses the same background luminance, test locations, and dB scale, and its results are presented in the same format as Humphrey perimetry to aid comparisons. However, there are differences, primarily related to threshold algorithm. According to Prof. Henson, the implications of those differences is a matter of perspective. From a research perspective, they are indeed meaningful, as the extensive use of the Humphrey 24-2 testing in glaucoma has provided a wealth of knowledge which has contributed significantly to the development of new ideas in perimetry, such as those that led to the development of ZATA and Smart Supra. From a clinical perspective, though, ZATA and Humphrey perimetry each provide similar results within the range of test/retest results from the same perimeter. As a result, the reports generated by Humphrey perimetry and those generated by Henson perimeters, particularly in the options for deviation probability maps, are indeed comparable.
“If you’ve seen patients, and you’re monitoring them over a long period of time, an important aspect of monitoring is to use the same test,” Prof. Henson said. “If you have, say, 4 or 5 years of data with a threshold test, and you don’t really want to quickly switch to a totally different type of test, ZATA is important to give compatibility with previous results from the patient.”

ABOUT THE INTERVIEWEE
David B. Henson, PhD., is Emeritus Professor of Ophthalmology & Vision Science at Manchester University, United Kingdom and inventor of the Henson.
Financial disclosure: Inventor of Henson
References:
1. Henson DB, Chaudry S, Artes PH, et al. Response variability in the visual field: comparison of optic neuritis, glaucoma, ocular hypertension, and normal eyes. Invest Ophthalmol Vis Sci. 2000;41(2):417-421.
2. Gardiner SK, Swanson WH, Goren D, et al. Assessment of the reliability of standard automated perimetry in regions of glaucomatous damage. Ophthalmology. 2014;121(7):1359-1369.
3. De Moraes CG, Hood DC, Thenappan A, et al. 24-2 Visual fields miss central defects shown on 10-2 Tests in glaucoma suspects, ocular hypertensives, and early glaucoma. Ophthalmology. 2017;124(10):1449-1456.
4. Wang Y, Henson DB. Diagnostic performance of visual field test using subsets of the 24-2 test pattern for early glaucomatous field loss. Invest Ophthalmol Vis Sci. 2013;54:56-761.
5. Traynis I, De Moraes CG, Raza AS, et al. Prevalence and nature of early glaucomatous defects in the central 10° of the visual field. JAMA Ophthalmol. 2014;132(3):291-297.
6. Henson DB, Emuh T. Monitoring vigilance during perimetry with pupillography. Invest Ophthalmol Vis Sci. 2010;51:3540-3543.
7. Gardiner SK, Swanson WH, Goren D, et al. Assessment of the reliability of standard automated perimetry in regions of glaucomatous damage. Ophthalmology. 2014;121(7):1359-1369.
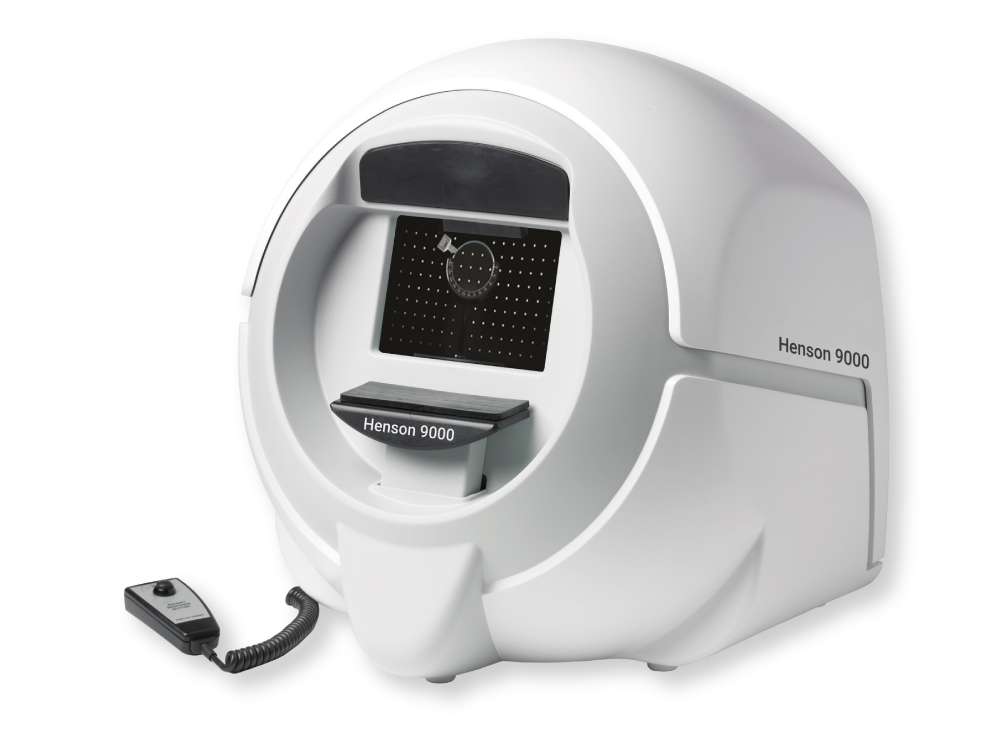
Henson 9000
Advanced detection and monitoring of the visual field
Recent Posts

Don’t Miss Topcon Healthcare’s Limited-Time Summer ’26 Offers
As eye care continues to evolve, practices are looking for…
Read more
Topcon Healthcare Expands Access to Standardized DICOM OCT Imaging Data
Topcon Healthcare is making its DICOM OCT Export Tool publicly available, giving its researchers a…
Read more
Powering Oculomics Research with the IDHea® Workplace Screening Dataset
Experience a new standard in ophthalmic-driven insights with the new…
Read more