Elevate Your Myopia Management Practice Using the Topcon MYAH®
Investing in the proper tools at the outset will allow you to distinguish yourself as a myopia management specialist, give patients confidence in your decision-making that will maintain them in your practice, and provide you with the insights needed to make custom treatment plans.
One of the most common questions when starting myopia management is: what equipment do I need to be successful? We all know that axial length (AL) is quickly becoming the gold standard for monitoring myopia progression, and yet one of the most common strategies when entering the myopia management field is to wait to build patient volume before committing to purchase a biometer. I would argue that you are limiting your success before even getting started. Investing in the proper tools at the outset will allow you to distinguish yourself as a myopia management specialist, give patients confidence in your decision-making that will maintain them in your practice, and provide you with the insights needed to make custom treatment plans.
Myopia Management as a Specialty
Picture your typical day in practice. How many kids with myopia would you guess come through your office daily? A recent analysis of the 2020 census data estimates that there are 278 myopic children for every one eyecare provider, including both ophthalmologists and optometrists1. This means that if you work 5 days per week, you should at minimum expect to see one myopia encounter per day (many of us are already seeing a lot more). These kids are out there, and they represent an unmet need. Despite the World Council of Optometry declaring myopia management to be the standard of care for myopic children in April of 2021, there are still not enough eyecare providers providing these services. Because of this, there is an opportunity for myopia management to grow as a specialty within our field and we should emphasize the use of biometry measurements in standardizing care. The best current eyecare analogy for myopia management as a specialty is glaucoma care. While it is possible to track glaucomatous change with fundoscopy alone, how many of us would choose to do so when we know there is a colleague down the road who can measure retinal nerve fiber layer thickness down to the micron using an OCT? Further, how many patients would be comfortable being managed without this technology if they knew it was available elsewhere? Biometry measurements are what distinguish myopia management from a refractive service and elevate it to a specialty service within our field.
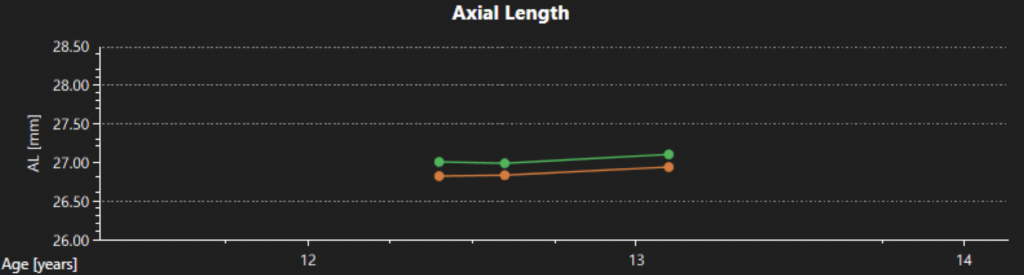
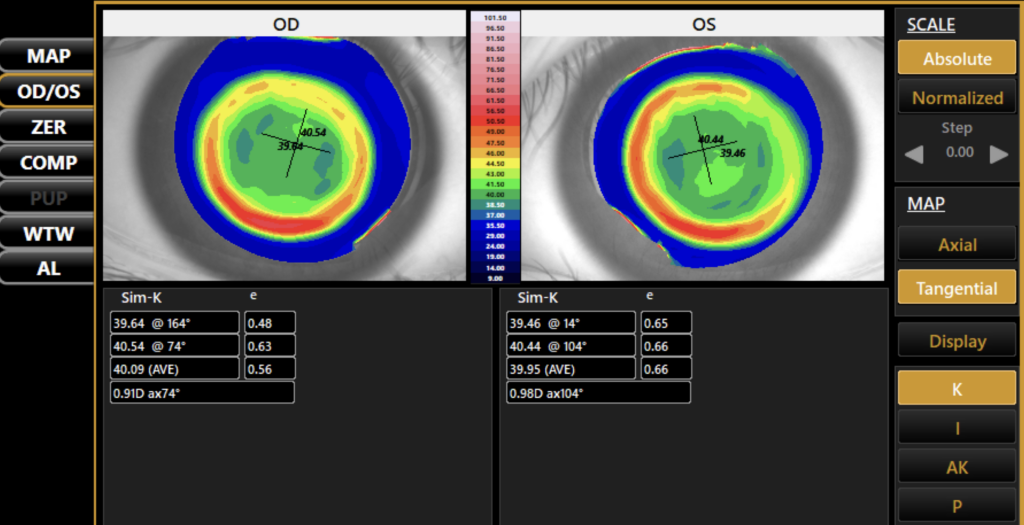
Until recently, another common limitation to adopting biometry measurements as the standard of care for myopia management was the redundancy of equipment and software. You could either purchase a topographer that was great for custom contact lens fitting but gave no information on AL or invest in an expensive biometer designed with cataract surgery in mind that had limited topography and no chronologic comparison capability. The only option was to pay for more than you needed and cherry-pick the important data out of a massive report. The Topcon MYAH offers a solution to this problem by focusing on the biometry measurements that are directly related to tracking myopia progression and collecting them in one simple scan. Using an intuitive, minimalistic interface, the MYAH can collect a topography and AL scan in approximately 5 seconds per eye, and dynamic pupillometry measurements in less than 30 seconds per eye. Its simplicity and speed make it ideal for testing children as young as five and the guided “point and shoot” measurement collection style is easy for staff to use. While the device does not contain an autorefractor, the software gives you the capability of recording refractive data along with AL and automatically creates graphs that track changes over time (See Figure 1). Personally, this is ideal, as I input my own manifest cycloplegic data into these graphs for best accuracy and do not prefer to use a non-dilated autorefraction measurement to track progression. Finally, the device automatically creates topography maps to analyze the patient’s corneal profile (See Figure 2), as well as comparison maps, which allow ortho-K fit success to be quickly and easily evaluated by assessing differences in corneal topography pre-and post-treatment.
Increased Parental Confidence and Patient Loyalty
Glancing down at my watch, I can instantaneously see a snapshot of my health in time. I could tell you how I slept last night, what my heart rate is, how many calories I’ve burned, and the list goes on. We live in a world obsessed with data analytics, and tracking biometric data is something that our patients are accustomed to and will expect from us as their eyecare providers. This is especially true when offering myopia management as a preventative, self-pay service. In my clinic, I provide parents with a copy of their child’s AL progression report at the end of every visit. This essentially becomes a report card of their progress within the program and gives them a tangible representation of their success. It allows them to be excited about something that they would otherwise not notice. This is especially important once a child’s myopia has stabilized, and they are no longer experiencing changes in their vision. Tracking biometry measurements allows our patients to see value in what we are providing and will keep them continually invested in their child’s visual health.
Increased Provider Confidence
For the past decade, myopia has arguably been one of the hottest topics in eye research with hundreds of new publications each year. As the field of myopia continues to grow, so does our access to large-scale demographic data on expected AL and refractive error changes over time2,3. As eyecare providers, we can translate this data into the clinical setting by using it to help assess risks of myopia onset and rapid progression for our patients. During my initial myopia management consultation, I plot my patient’s AL data as it relates to their age and ethnicity. If their baseline AL is greater than the 75th percentile, it raises a flag that they may be at risk of rapid progression. I use this information in my discussion with parents when deciding if treatment should be initiated. Once we have started myopia management, AL demographic data can be used to help tailor our treatment plans to each patient as an individual. If my patient’s AL progression is faster than expected for their age, I can increase atropine concentration or switch to a dual therapy until I see the desired flattening of their growth curve. Finally, tracking AL for each patient can give us guidance on when to stop treatment and when it is necessary to restart. In my clinic, I have patients return six months after discontinuing treatment. If I see a spike in AL growth that is faster than expected for their age, it is a strong indication that treatment should be reimplemented. Essentially, these AL measurements allow you as the provider to be confident in your decision making and this in turn will make your patients confident in you.
Case Example with Atropine Response (click to expand)
A 6-year-old African American male came to our office as a new patient after failing a vision screening during his wellness exam with his pediatrician.
Patient history: passed photo screener test at age 5 and previously had no difficulty seeing in class
Family history: both parents moderately myopic, neither was a successful contact lens wearer
| OD AXL | OD cycloplegic RE | OS AXL | OS cycloplegic RE |
| 22.85 mm | -2.50 DS | 22.75 mm | -2.25 DS |
Baseline Data:
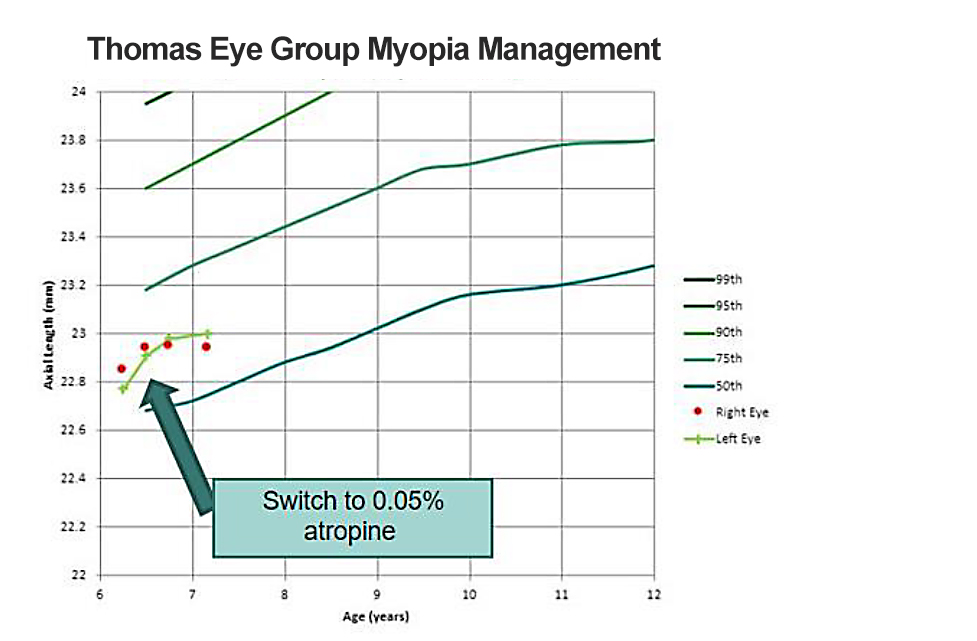
The patient’s axial length measurement indicated he was at approximately the 70th percentile for his age (see Figure 3). Given his young age, history of annual progression most likely > -1.00D OU, and parental history, we decided to start him on 0.025% atropine therapy.
Here are the steps that we took to further manage this case and the tracked changes in axial length within the course of 12 months:
| OD AXL progression | OS AXL progression | Treatment | |
| Baseline | 22.85 mm | 22.75 mm | Started on atropine 0.025% |
| 3 mo. follow-up | +0.09 mm | +0.14 mm | Increased to atropine 0.05% |
| 6 mo. follow-up | +0.00 mm | +0.02 mm | Continue 0.05% |
| 12 mo. follow-up | +0.00 mm | +0.04 mm | Continue 0.05% |
| Total Progression | +0.09 mm | +0.20 mm |
At the 3-month progress check, the patient reported that he loved his glasses and was still seeing well out of them. He was using atropine drops nightly and was not having any significant side effects of light sensitivity or near blur. When his AL was measured, we found that he had progressed. While we know that younger children do have a larger amount of physiologic AL change, the slope of his growth curve appears much steeper than expected for his age, indicating that his myopia progression was not adequately controlled.
I decided to increase his concentration to 0.05%. At the 6-month follow-up, the patient reported that he was tolerating his drops well and had not noticed a change in side effects with the increased concentration. We found that his axial length was much better controlled. I continued the 0.05% concertation and at the end of his first 12 months, he progressed a total of 0.09mm OD and 0.20mm OS in his AL, with a growth curve flatter than his peers after switching to 0.05%. His refractive error remained unchanged OD and only progressed –0.50D OS. He was considered well-controlled on therapy and his parents were thrilled with the results.
Conclusion
Axial length data is critical to help convey the value and efficacy of myopia management interventions. In my case example, having access to AL allowed the patient’s parents to understand why I increased his atropine concentration and why some myopia progression is still expected despite therapy. Tracking changes in axial length is also crucial to help inform treatment decisions, especially in cases where progression continues to be noted with initial therapy. Again, in the case of my patient, I can use this data to help determine if dual therapy is necessary or to ensure that he remains well-controlled if the family wishes to switch to a contact lens design for myopia management. Finally, once a patient’s growth curve has stabilized for several years and the family wishes to discontinue treatment, I can advise them if treatment should be restarted. Having access to chronologic AL data for all patients significantly elevates the treatment plan and gives confidence to both myself and the parents that myopia management is effective and worthwhile.
References
1. Fortin P, Kwan J. The Myopia Management Opportunity in the United States Using the 2020 Census. ARVO 2022, Denver, CO.
2. McCullough, S., Adamson, G., Breslin, K.M.M. et al. Axial growth and refractive change in white European children and young adults: predictive factors for myopia. Sci Rep 10, 15189 (2020). https://doi.org/10.1038/s41598-020-72240-y
3. Sanz Diez P, Yang LH, Lu MX, Wahl S, Ohlendorf A. Growth curves of myopia-related parameters to clinically monitor the refractive development in Chinese schoolchildren. Graefes Arch Clin Exp Ophthalmol. 2019;257(5):1045-1053.
MCA: 5349

MYAH offers a versatile, reliable, and efficient way to monitor axial length, corneal topography, and meibomian gland health.
Recent Posts

Don’t Miss Topcon Healthcare’s Limited-Time Summer ’26 Offers
As eye care continues to evolve, practices are looking for…
Read more
Topcon Healthcare Expands Access to Standardized DICOM OCT Imaging Data
Topcon Healthcare is making its DICOM OCT Export Tool publicly available, giving its researchers a…
Read more
Powering Oculomics Research with the IDHea® Workplace Screening Dataset
Experience a new standard in ophthalmic-driven insights with the new…
Read more